

A grow light can publish an impressive photon output and still produce an uneven or unsuitable canopy. The reason is simple: fixture output describes photons leaving the luminaire, while plants respond to photons arriving at leaf level. A useful buying decision therefore requires both the source metric and a spatial measurement of the installed light field.
Comparing only the largest number can reward concentrated output, hide weak edges, and ignore whether test conditions match the grow room. The better question is how effectively the emitted light reaches the planned canopy.
PPF vs Canopy PPFD: Source Output and Delivered Intensity
What PPF Reveals About a Grow Light Fixture
Photosynthetic photon flux, or PPF, is the total rate at which a fixture emits photons in the photosynthetically active radiation range, expressed in micromoles per second. It compares source output and supports efficacy calculations when paired with input power.
PPF does not describe where those photons travel. A single total cannot show the size of the illuminated area, the intensity at the corners, the effect of hanging height, or losses beyond the crop boundary. Two fixtures with similar PPF can therefore create very different canopy conditions.
What Canopy PPFD Reveals About the Light Plants Receive
Photosynthetic photon flux density, or PPFD, measures the photon rate reaching one square meter each second. It belongs to a specific point on a measurement plane; a canopy PPFD map turns many readings into a picture of distribution.
That map shows whether edges remain productive, the center is excessive, and neighboring fixtures overlap cleanly. At TIDESTAR, we treat fixture output as a starting specification and the canopy map as the evidence needed to judge delivery.
Why High Fixture PPF Can Still Miss the Canopy
Height, Optics, Spacing, and Area Reshape the Photon Field
Increasing hanging height usually broadens the footprint while reducing point intensity. Lowering a fixture concentrates light but can create a hotspot or weak perimeter. Optics, diode placement, frame width, and fixture spacing determine where beams overlap.
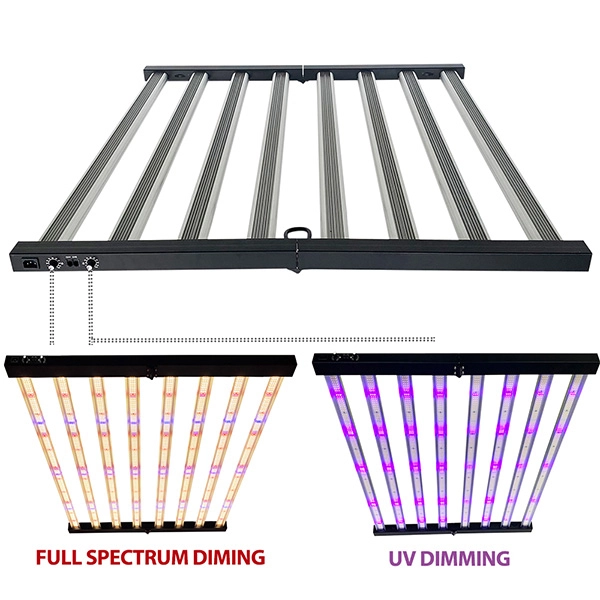
Distributing the same captured photons across a larger canopy lowers the possible average PPFD. Our 1000W 1200W 1400W 4x6FT LED Grow Lights Samsung lm301B Full Spectrum Lamp uses a 12-bar frame with Samsung LM301B white LEDs and Osram 660 nm LEDs. It is listed for a 4-by-6-foot area and supports dimming with passive thermal management, but its installed map still depends on height and room conditions.
Reflections, Room Boundaries, and Canopy Architecture Change Photon Capture
Reflective tent walls can return light that would otherwise leave the footprint. Dark surfaces, aisle gaps, and wide spacing may let more photons miss the crop. A reflective-enclosure map should not be compared directly with an open-room map without noting the difference.
Plants also change the field: tall tops sit closer to the fixture, overlapping leaves cast shadows, and dense canopies affect lower foliage. A bare-floor map helps with setup, but a follow-up at active canopy height is more representative.
What a Trustworthy Canopy PPFD Map Must Show
Normalize Height, Footprint, Dimming, and Test Environment
A credible map states fixture-to-sensor distance, mapped dimensions, grid spacing, dimmer setting, and environment. It should identify whether readings came from a flat plane, reflective walls, or overlapping fixtures. Missing conditions make even a precise-looking heat map unreliable.
Use the same canopy dimensions, height, power setting, sensor orientation, and grid. For different claimed footprints, compare the portion of each map serving the same crop target rather than treating unequal test areas as equivalent.
Read Average, Minimum, Maximum, Uniformity, and Edge Performance Together
Average PPFD summarizes the mapped area, but it can hide a bright center and dim corners. Minimum and edge readings reveal weak production zones, while the maximum exposes potential hotspots. A practical uniformity indicator is minimum PPFD divided by average PPFD; the closer the result is to one, the smaller the gap between the weakest point and the overall level.
No statistic should stand alone. An excessive average can waste energy or stress a crop, while poor edges can create inconsistent growth. Ask what percentage of the full grid falls inside the target band.
How to Compare Fixtures With Different PPF Ratings
Define the Crop Target, Canopy Area, and Operating Constraints First
Begin with crop stage, planted dimensions, PPFD target, mounting clearance, electrical capacity, and cooling limits. Room dimensions may exceed the productive canopy, so define the active area before comparing maps.
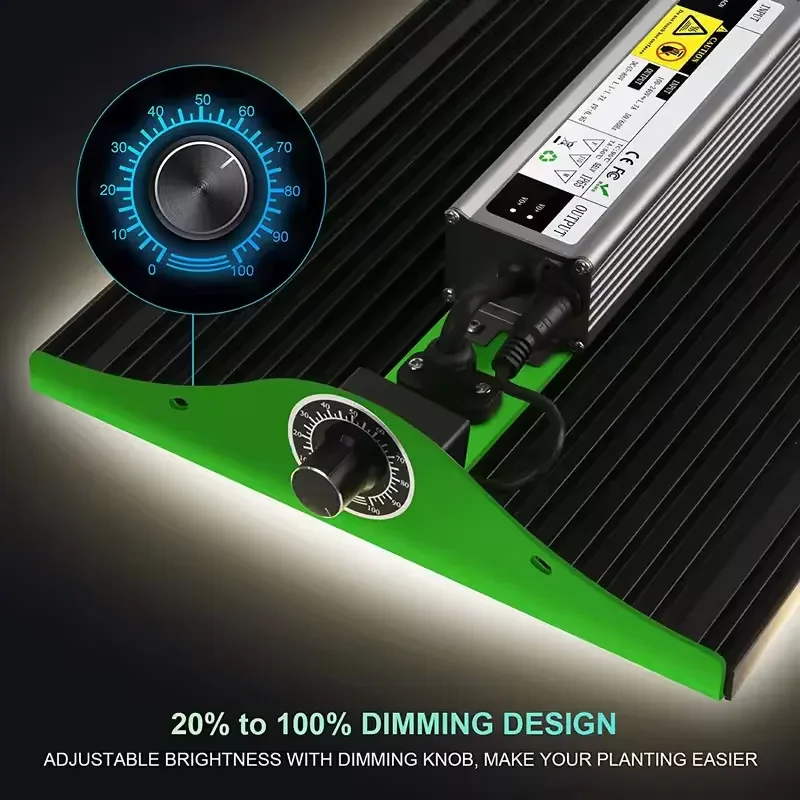
The Samsung 100w LED Grow Light Quantum Plate for Veg Bloom illustrates why stated conditions matter. This 100-watt panel has a dimmer knob and is listed for 2.5-by-2.5-foot vegetative coverage at 18 inches, compared with 2-by-2-foot flowering coverage at 14 inches. The fixture is unchanged; the operating height and crop target reshape the usable claim.
Estimate the Theoretical PPFD Ceiling Without Treating It as Delivered Light
A rough ceiling equals the photon rate available to the canopy divided by its area. It can expose impossible claims, but total PPF is not automatically captured by the crop. Spill, reflection, optics, and boundaries separate emitted output from delivered intensity.
Treat the estimate as a screen. If the required average approaches the idealized ceiling, the fixture is unlikely to meet the target. Even a generous ceiling still needs a measured map.
Compare PPFD Maps and Input Power Under Equivalent Conditions
Once conditions are normalized, compare average, minimum, edges, uniformity, and input power. Lower PPF may be preferable if more of the canopy stays in range at lower demand; higher PPF helps when it is delivered evenly across a larger active area.
Fixture geometry remains part of that result, as shown in our fixture design and canopy coverage guide. Use PPF to compare source scale, PPFD maps to compare delivery, and input watts to compare the operating cost of achieving the target.
How to Verify Canopy PPFD After Installation
Map the Installed Canopy With a Suitable Quantum Sensor
Create a repeatable grid and place a suitable quantum sensor level at leaf height. Under stable fixture settings, record every point and calculate average, minimum, maximum, and uniformity. Mark edges separately so the center cannot mask perimeter losses.
Repeat after changes to fixture height, plant height, spacing, or boundaries. Keep the grid and sensor orientation constant.
Tune Height, Dimming, and Spacing Before Connecting PPFD to DLI
Adjust one variable at a time. Raising can improve coverage but reduce intensity; dimming lowers hotspots; shifting adjacent fixtures can repair weak overlap. Remap until the canopy, not the label, meets the target.
Only then connect PPFD to daily light integral, or DLI, which accounts for intensity over the photoperiod. A stable canopy PPFD map makes that calculation meaningful. PPF remains valuable for equipment comparison, but delivered, uniform light over time is what turns fixture output into a workable crop-lighting plan.
FAQ
Q: What is the main difference between PPF and canopy PPFD?
A: PPF measures the total photon output of a fixture, while canopy PPFD measures photon density at specific points where plants receive light. PPF describes the source; a PPFD map describes delivery across the growing area.
Q: Can a fixture with higher PPF produce lower canopy PPFD?
A: Yes. A wider footprint, greater hanging height, unfavorable optics, open boundaries, or poor fixture spacing can spread or lose more photons. The result may be lower readings at important canopy points despite higher total output.
Q: Why is a single center PPFD reading not enough to compare grow lights?
A: A center reading cannot reveal edge falloff, corner intensity, hotspots, or uniformity. A grid-based canopy PPFD map provides minimum, maximum, average, and spatial information needed for a fair comparison.
Q: How should growers compare PPF vs PPFD data from different fixtures?
A: Compare PPF as a source-output metric, then compare PPFD maps measured over the same footprint, height, dimmer setting, grid, and environment. Include input power and crop targets before deciding which fixture performs better.
Q: How does canopy PPFD relate to DLI?
A: Canopy PPFD is an instantaneous photon-density measurement. DLI integrates that intensity over the daily photoperiod, so reliable DLI planning begins with representative PPFD values across the canopy rather than one peak reading.


