
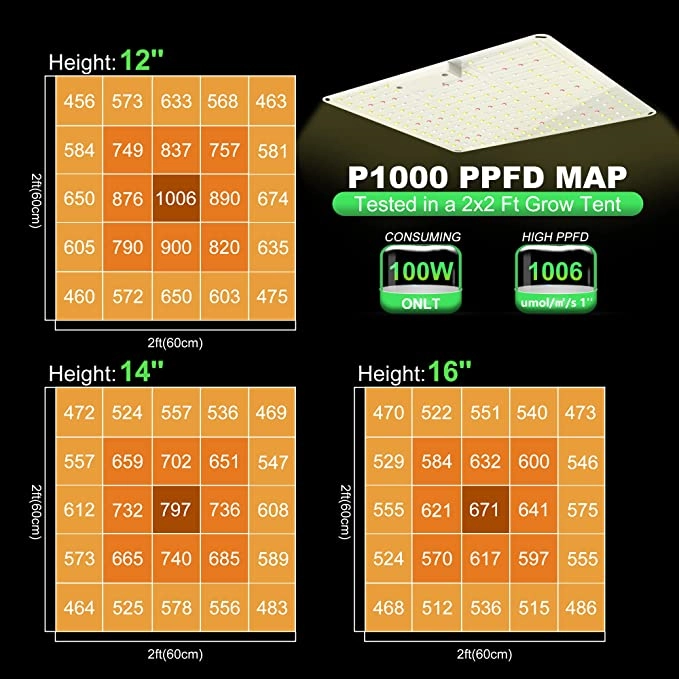
A PPFD map shows how much photosynthetically active light reaches different canopy points. Each grid value is Photosynthetic Photon Flux Density, measured in micromoles per square meter per second. Unlike a center reading, it reveals edge falloff.
The map is therefore useful for comparing an LED Grow Light, but only after checking its footprint, hanging height, dimmer setting, test environment, and grid density.
What a PPFD Map Can and Cannot Tell You
How PPFD Differs From PPF, PPE, and DLI
PPF measures the total photosynthetic photons produced each second. PPE, often called fixture efficacy, relates that output to electrical input. PPFD measures the photons arriving at a particular square meter of canopy, while Daily Light Integral combines PPFD with the photoperiod.
PPE compares energy conversion, a PPFD map shows where output lands, and DLI indicates how much light accumulates each day.
Why a Peak Center Reading Does Not Prove Full-Canopy Coverage
The center cell is commonly the highest. Treat it as a peak, not every plant’s experience. A strong center can coexist with weak corners or a narrow usable footprint.
When reviewing our TIDESTAR LED Quantum Panel range, buyers should compare the complete grid with their canopy dimensions instead of choosing a panel from its maximum PPFD alone.
Verify the Test Conditions Before Comparing PPFD Maps
Check the Footprint, Grid Density, Hanging Height, and Power Setting
Start with the mapped width and length. A 2 x 2 ft map cannot be compared directly with a 3 x 3 ft map. Confirm that the outside row reaches the advertised boundary and the grid exposes hot or dark zones.
Confirm the distance between light and sensor, plus dimmer percentage or measured input power. Lower heights and smaller footprints can inflate apparent performance.
Account for Sensor Type, Reflective Walls, and Open-Room Testing
A quantum sensor should remain level at canopy height. Angled readings, inconsistent spacing, or sensor shading distort results. Reflective tent walls can also raise readings.
The image below maps one fixture at three heights, demonstrating why height must accompany every PPFD claim.
How to Read a PPFD Map in Five Practical Steps
Read the Center, Average, Minimum, and Maximum Values Together
First confirm area and height. Second, locate the maximum. Third, find the average. Fourth, identify the minimum at edges and corners. Fifth, compare the pattern with the plant layout.
Two maps can share an average yet behave differently. A smooth grid is easier to manage than one with an extreme center and weak perimeter.
Calculate Uniformity and Locate Hot Spots, Weak Edges, and Dark Zones
A practical uniformity ratio is minimum PPFD divided by average PPFD. Some suppliers use minimum divided by maximum, so verify the formula. One ratio cannot show a problem’s location.
Mark cells above the crop target as hot spots, then identify weak edges and internal dark bands. A dark strip through planted rows may require different fixture spacing.
Red Flags That Make a PPFD Map Difficult to Trust
Missing Test Details and Cropped Measurement Footprints
A map omitting height, power, footprint, sensor type, or wall conditions cannot be reproduced or compared fairly.
A cropped grid may hide edge falloff when its outside points stop inside the claimed coverage. Judge performance at the boundary where plants will sit.
Color-Only Heatmaps, Inconsistent Scales, and Unclear Units
Colors aid scanning, but every cell should have a readable value. Changing scales can make a weaker map appear equally bright, so compare identical ranges.
PPFD uses micromoles per square meter per second. Do not confuse it with PPF or PPE. If labels or conditions conflict, request the raw grid.
Match the PPFD Map to Crop Stage and Daily Light Demand
Convert PPFD Into DLI for the Planned Photoperiod
PPFD is an instantaneous rate; DLI accounts for operating time. Approximate DLI by multiplying PPFD by lighting seconds per day and dividing by one million. For example, 500 micromoles per square meter per second for 16 hours produces about 28.8 moles per square meter per day.
Calculate DLI for average and weaker zones. Targets vary with crop, stage, temperature, carbon dioxide, and irrigation; no single PPFD value is universal.
Define the Usable Canopy Area Instead of Accepting Advertised Coverage
Choose the crop’s acceptable PPFD band and count the cells inside it. That is the usable footprint. Other cells should not be counted as full-intensity coverage.
If the center is too bright while corners remain weak, adding power worsens the imbalance. Raise the fixture, reduce the planted area, or choose a wider layout.
Use PPFD Data to Choose and Configure an LED Grow Light
Compare Quantum Panel Efficiency With Real Canopy Distribution
Quantum Panel Efficiency concerns photons per unit of electricity; a PPFD map concerns distribution. Compare identical footprints, heights, wall conditions, and input power.
The 1000W 1200W 1400W 4x6FT LED Grow Lights Samsung lm301B Full Spectrum Lamp is presented as a twelve-bar fixture for uniform PPFD across 4 x 6 ft. At TIDESTAR, our role is to help buyers match such fixture-level claims to actual bench dimensions and mounting limits.
Build a Quantum Panel Setup With the Right Height, Dimming, and Fixture Spacing
For a Quantum Panel Setup, adjust height and dimming together. Lowering raises intensity and may sharpen edge falloff; raising broadens coverage but lowers the peak. With several fixtures, measure overlap zones.
The Samsung 100w LED Grow Light Quantum Plate for Veg Bloom includes dimming and different vegetative and flowering coverage conditions. After installation, map the canopy and record height, power, and grid.
FAQ
Q: What does a PPFD map show for an LED Grow Light?
A: It shows the intensity and distribution of photosynthetically active photons across a defined canopy area. A useful map also identifies the hanging height, power setting, grid spacing, and test environment.
Q: What PPFD numbers should be checked before choosing an LED Grow Light?
A: Check the average, minimum, maximum, center reading, and uniformity ratio. Their locations and the mapped footprint matter as much as the values themselves.
Q: Can Quantum Panel Efficiency predict PPFD uniformity?
A: No. Efficiency describes photon output per unit of electrical energy. Board dimensions, diode spacing, optics, height, and room reflections determine how evenly those photons reach the canopy.
Q: How does hanging height affect a Quantum Panel Setup?
A: A lower height generally increases intensity and may create a steeper center-to-edge gradient. A higher position spreads light farther but reduces peak PPFD. Measure after each adjustment.
Q: Should a PPFD map be measured again after installing an LED Grow Light?
A: Yes. Remap after changing fixture height, dimming, spacing, canopy position, or reflective surfaces. The installed room can differ significantly from a manufacturer’s test environment.